
Reading bar graphs grade 1 worksheets PDF
These are the free printable bar graphs worksheets PDF for grade 1 for understanding and reading the graphs. Please download these worksheets by clicking on the images or links shown below.
What is a bar graph?
- A bar graph is a way to show information using bars of different heights.
- Every bar stands for a collection of items.
- More things are represented by a taller bar.
Similar worksheets:
Check out the page: Maths worksheets for all kind of maths related worksheets for grade 1 kids.

Download the worksheets
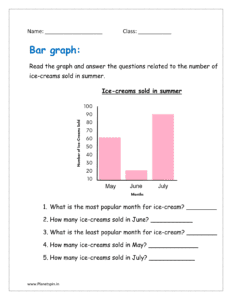
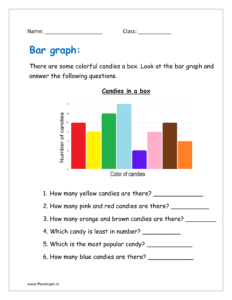
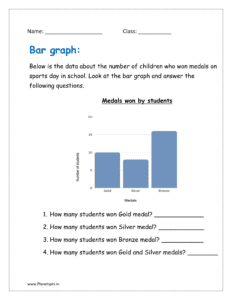
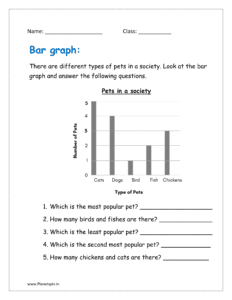
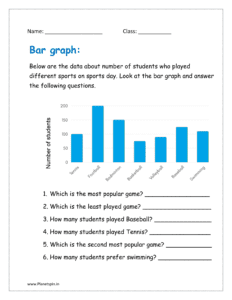
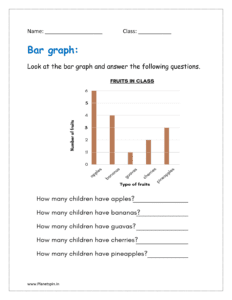
Below are the bar graph related different worksheets which will help children to analyze the data in the form of numbers, categories and graphs and help in answering the simple questions.
Concept of bar graphs
- Helps children understand how to collect, organize, and display data.
- Helps them to observe patterns and make comparisons.
- Helps in developing counting and number sense.
- Children practice counting objects and representing them in a graph.
- Bar graphs provide a clear, easy-to-read representation of information.
- Children analyze data and answer simple questions.